What goes in a market entry strategy deck, with a worked example
Recommendation first, then the market screen, size of the prize, entry routes, business case, a roadmap with gates and the ask. Worked on Eurostat data.
A market entry strategy deck answers four questions in this order: which market, how to enter it, what it takes and when it pays back, and in what sequence. Put the recommendation on page one, then the market screen, the size of the prize, the entry routes compared, the business case, a roadmap with gates, and the decision you need.
Below is that order slide by slide, then one case worked through it: seven EU markets screened on real Eurostat data for a fictional German online furniture retailer, and five slides built from the result with Decky AI, the PowerPoint agent that publishes this blog. The brief is printed so you can see what went in.
Which slides does a market entry deck need, and in what order?
A market entry deck needs about a dozen content slides, grouped under the four questions a committee asks in turn: which market, how we enter, what it takes and when it pays back, and in what order. The executive summary comes first and carries the whole answer, so a reader who stops after page one still knows what you recommend and what you are asking for.
| Slide | Question it answers | What goes on it |
|---|---|---|
| 1. Executive summary | What do we recommend, and why? | The answer as the title, three or four findings with their numbers, the decision asked for. |
| 2. Why look abroad | Why grow outside the home market? | The home-market trend that forces the question. |
| 3. Market screen | Which markets clear the bar? | Candidates scored on a few weighted criteria, each with its dataset and year. |
| 4. Headroom | Is there room left in the leading markets? | Penetration or spend against a benchmark such as income. |
| 5. Size of the prize | How much can we win, and by when? | Market size, the share within reach, the assumptions behind both. |
| 6. Country deep dive | Where in the country do we start? | Regions or cities, segments, the competitors already there. |
| 7. Entry routes | How do we enter? | Routes ordered by commitment, with capital, time to first sales, what each costs and what it buys. One marked as recommended. |
| 8. Risks of the route | On what conditions do we go ahead? | Pros, cons and the conditions attached to the recommendation. |
| 9. Cash profile | How much goes in, and when does it come back? | Investment and operating cash by year, and the payback year. |
| 10. Business case | Does it pay? | Net present value, internal rate of return, payback, and the assumptions that drive them. |
| 11. Sensitivities | What would change the answer? | The inputs that move the return most, often as a tornado chart. |
| 12. Roadmap with gates | In what order, and what releases each step? | Waves of markets, with a measurable trigger between waves. |
| 13. The ask | What must be decided today? | The decision, the budget, the next milestone. |
Two slides decide whether the deck holds up in the room. The screen has to show its data, its weights and how the ranking moves when the weights change, because that is what a sceptical board member tests first. The roadmap has to name the condition that releases each wave, so the committee can approve the first step without committing to all of them.
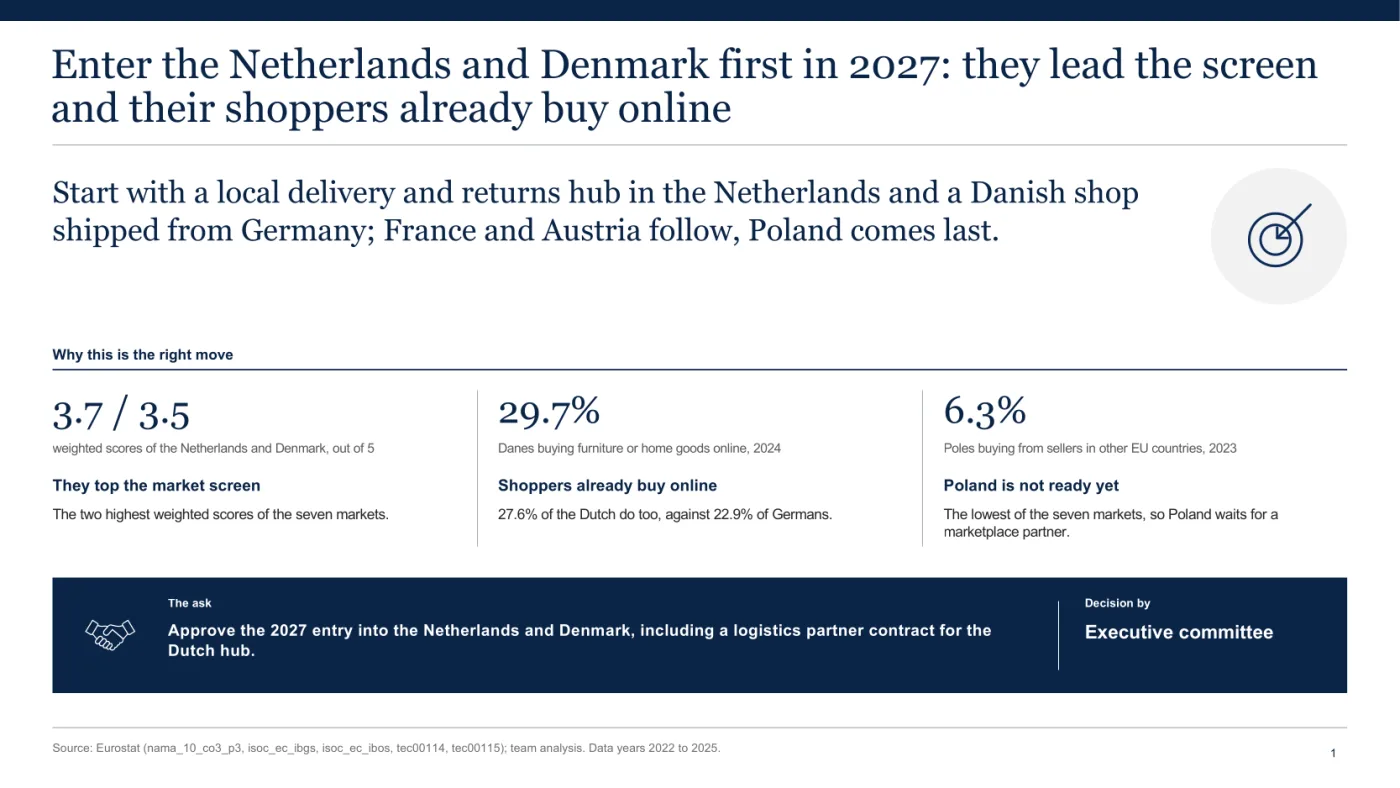
In the worked example, slide 1 recommends entering the Netherlands and Denmark in 2027, adding France and Austria once the first two markets cover their own delivery and returns cost, and reaching Poland last, through a marketplace partner. Three numbers carry the argument: weighted scores of 3.7 and 3.5, the 29.7% of Danes who buy furniture or home goods online, and the 6.3% of Poles who buy from sellers in other EU countries.
How do you build a market screen a committee will accept?
Choose four to six criteria you can get for every candidate market from one comparable source, convert each to a common score, weight them, and show the weights and a second weighting on the slide. A screen that cannot say why a criterion carries 30% gets argued about instead of decided on.
For EU markets that source is Eurostat, which publishes the same accounts and survey data for every member state. The furniture retailer’s five criteria came from five datasets:
- A. Household spending on furniture and furnishings, 2022, EUR billion (nama_10_co3_p3, COICOP CP051), the latest year all seven markets publish.
- B. Share of people who bought furniture, home accessories or garden products online in the last three months, 2024 (isoc_ec_ibgs).
- C. Share of people who bought online from sellers in other EU countries in the last three months, 2023, the last year of that dataset (isoc_ec_ibos).
- D. GDP per head in purchasing power standards, EU = 100, 2025 (tec00114).
- E. Real GDP growth per head, 2025 (tec00115, the per-capita series).
The survey shares count people aged 16 to 74, the population of Eurostat’s survey on internet use. The candidates are Germany’s EU neighbours with more than 5 million people, which leaves out Luxembourg and its 690,959 people on 1 January 2026 (tps00001). Some 2022 spending values and 2025 GDP values are provisional, and the years differ by criterion, so the source line on every slide says “Data years 2022 to 2025”.
I computed each score by min-max scaling across the seven markets, 1 + 4 x (value - lowest) / (highest - lowest), rounded half up to a whole point: the weakest market on a criterion scores 1 and the strongest 5. The weights are spend 30%, online furniture buying 30%, cross-border buying 20%, GDP per head 10% and growth 10%. The two furniture criteria, spend and online buying, carry 60% between them, and an equal-weight run tests that choice.
Published guides to this deck mostly leave the data out. On 2 November 2026 the top search results for three phrasings of this query were checked for each page’s external links to statistics offices, governments, international bodies, journals and firm websites, and for lines starting with “Source:”. Of 16 pages fetched, 14 could be read. One links a primary source, a 2001 Harvard Business Review article. None links a statistics office, and none carries a source line. One names Eurostat as a source to use, without a link or a single figure from it.
That 2001 article also names what a country screen misses. In Distance still matters, Pankaj Ghemawat argued, as HBR’s summary puts it, that “companies routinely overestimate the attractiveness of foreign markets”, because they ignore the distance between countries. His CAGE framework measures that distance as cultural, administrative, geographic and economic. A screen also says nothing about whether you can win: the GE-McKinsey nine-box judges a business on industry attractiveness and competitive strength together. The screen is the first half of the argument.
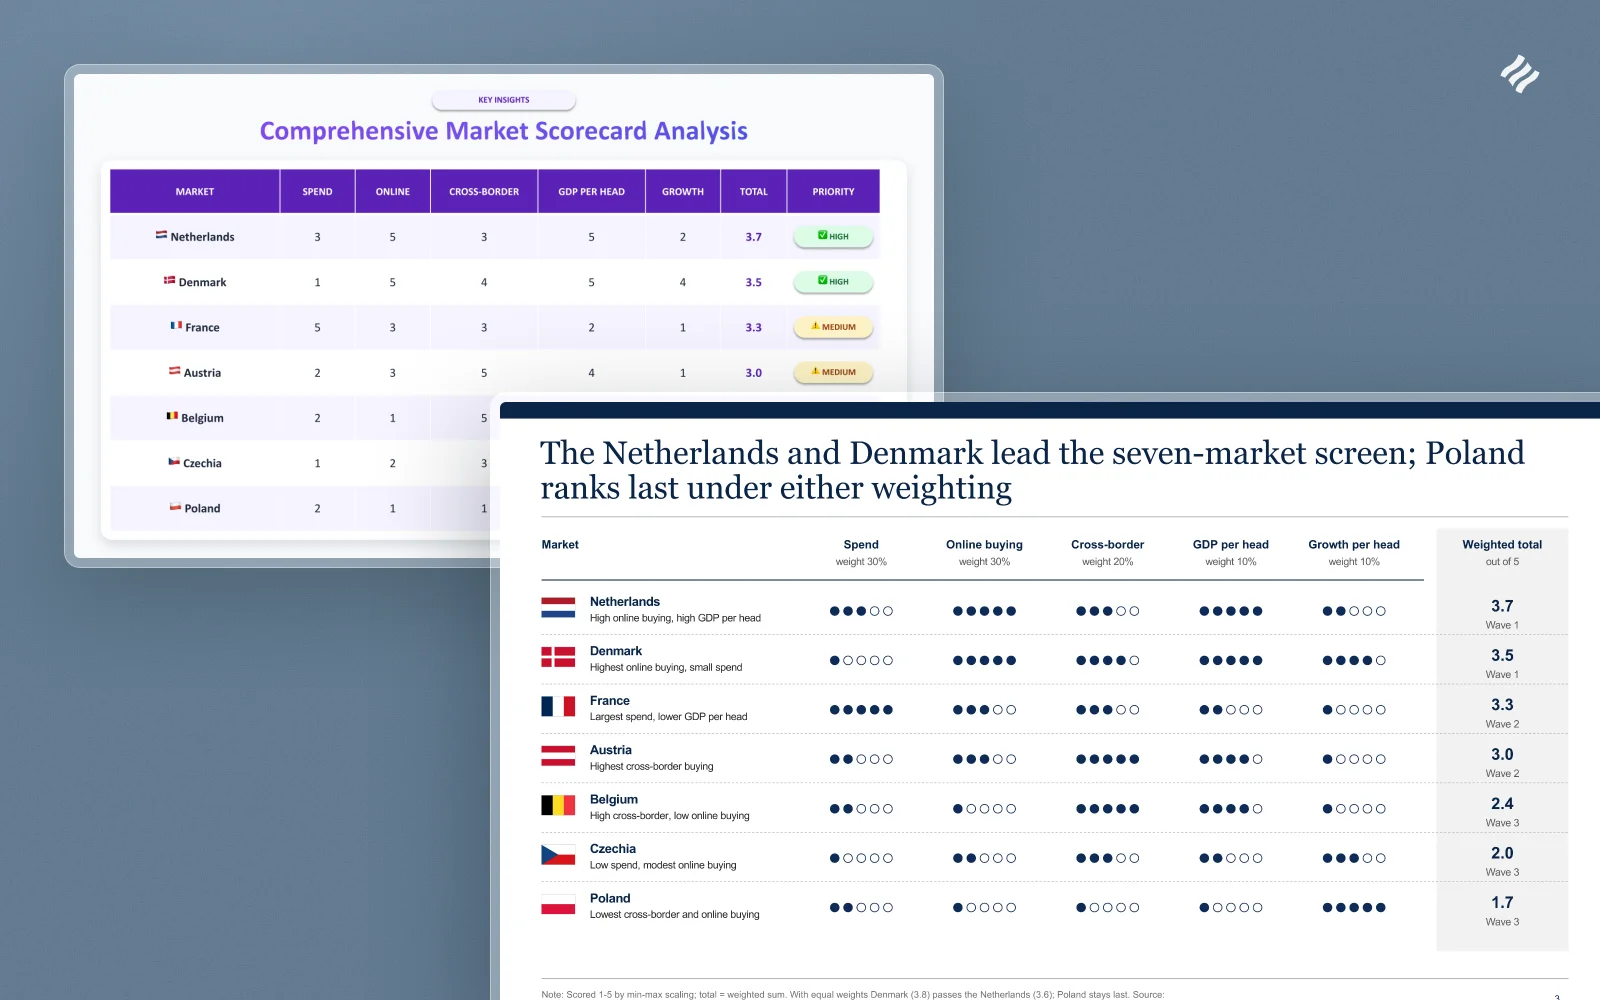
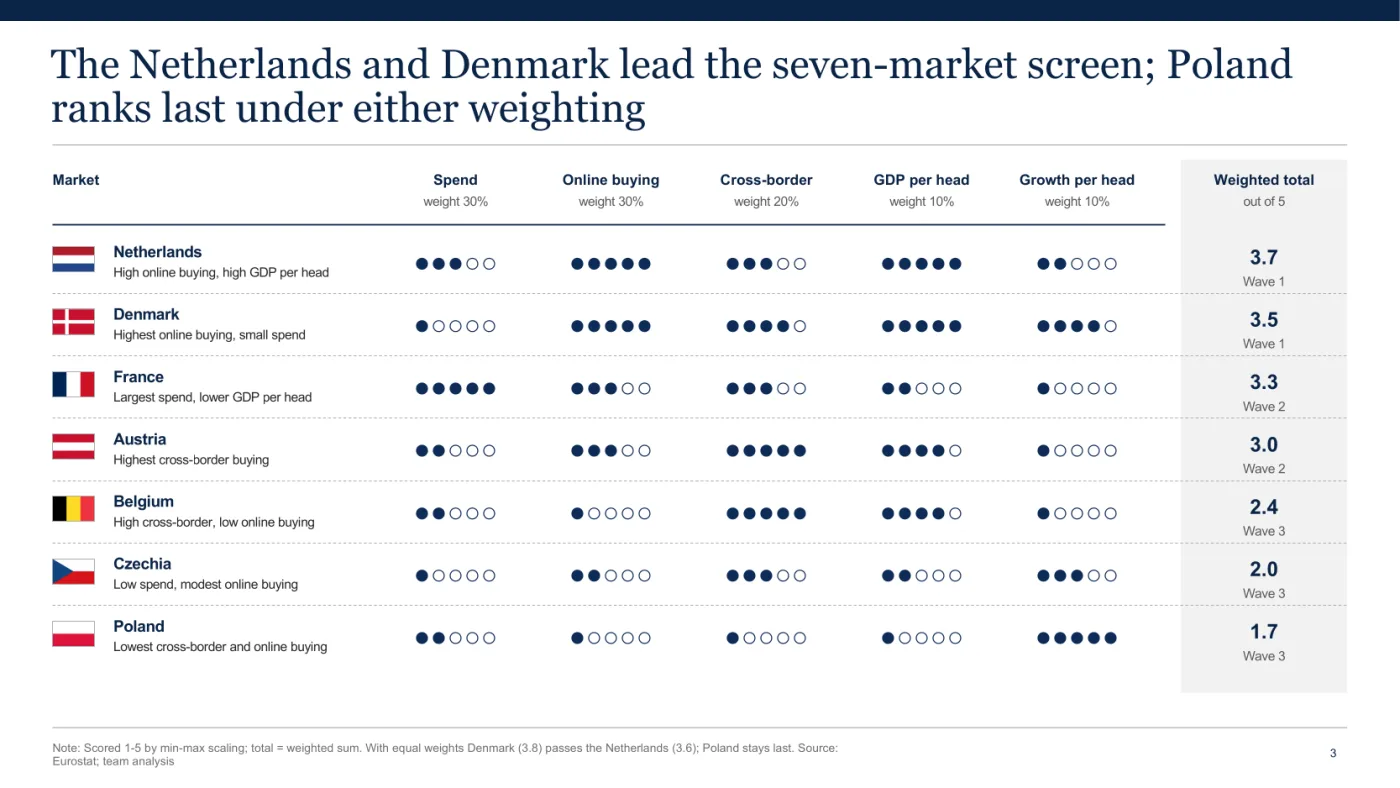
For a German online furniture retailer, the Netherlands and Denmark lead and Poland ranks last
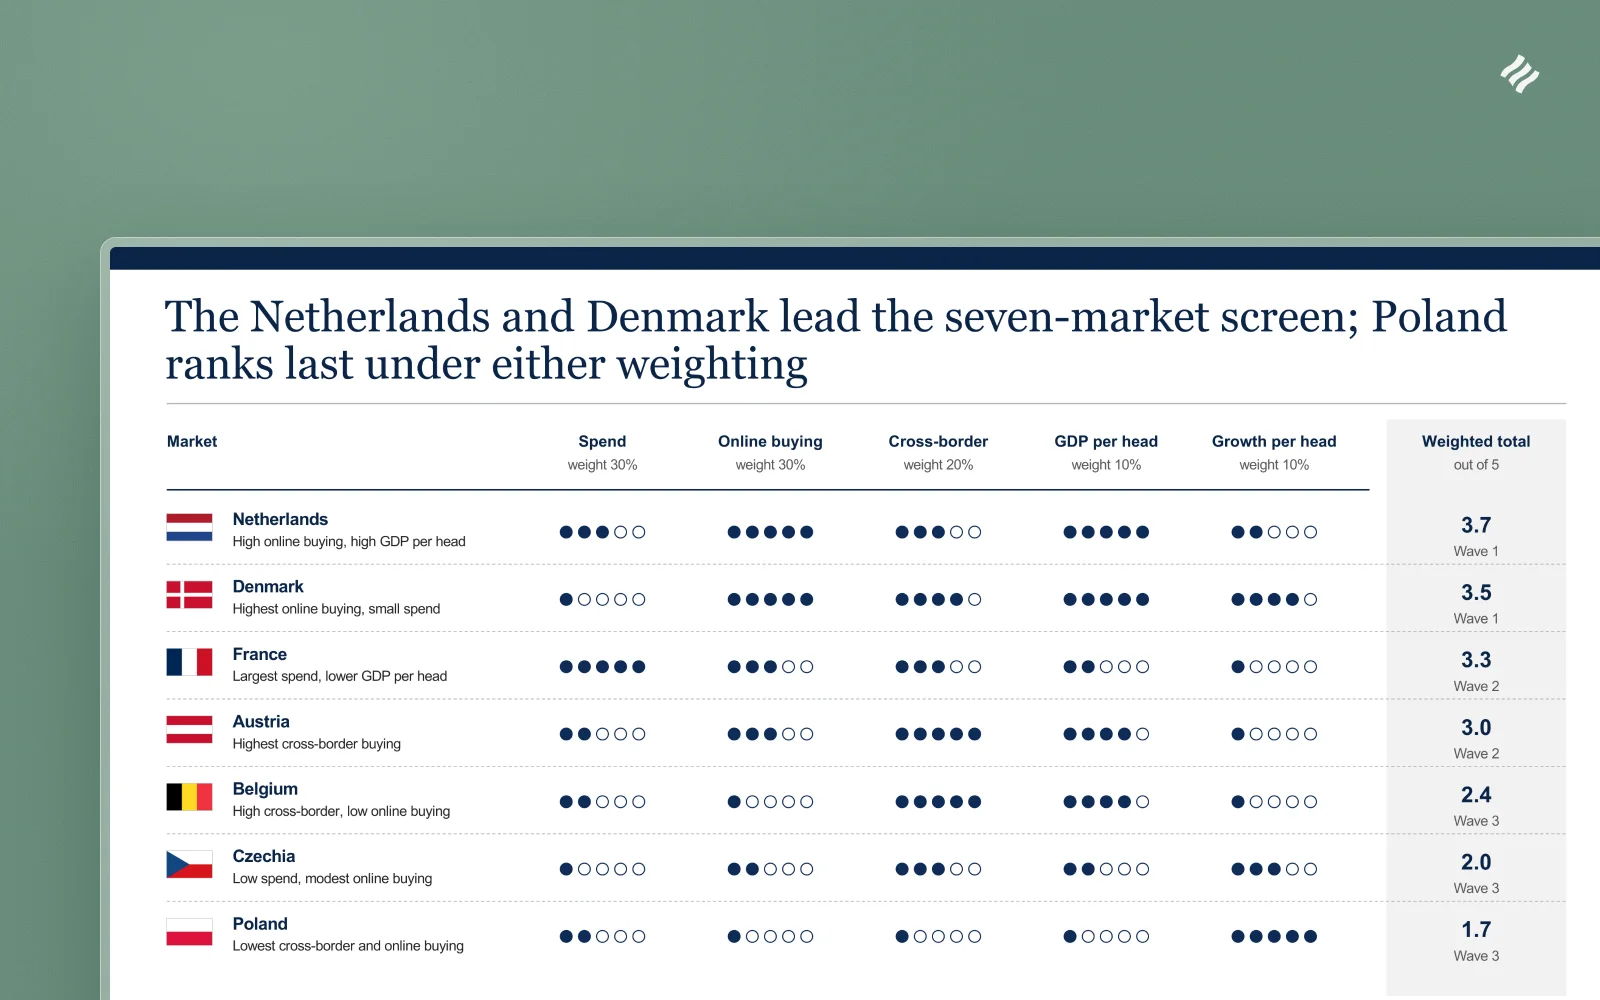
With weights of 30, 30, 20, 10 and 10%, the Netherlands scores 3.7 out of 5 and Denmark 3.5, ahead of France (3.3) and Austria (3.0); Belgium, Czechia and Poland follow at 2.4, 2.0 and 1.7. Weighted equally, Denmark (3.8) passes the Netherlands (3.6) and Austria passes France, while Poland stays last. Raw values come from the Eurostat datasets nama_10_co3_p3, isoc_ec_ibgs, isoc_ec_ibos, tec00114 and tec00115, rounded to one decimal.
| Market | A. Spend 2022, EUR bn | B. Bought furniture online 2024, % | C. Bought from other-EU sellers 2023, % | D. GDP per head 2025, EU = 100 | E. Growth per head 2025, % | Scores A to E | Weighted | Equal weights |
|---|---|---|---|---|---|---|---|---|
| Netherlands | 10.0 | 27.6 | 29.0 | 133 | 1.0 | 3, 5, 3, 5, 2 | 3.7 | 3.6 |
| Denmark | 3.6 | 29.7 | 31.8 | 127 | 2.9 | 1, 5, 4, 5, 4 | 3.5 | 3.8 |
| France | 19.8 | 22.1 | 25.4 | 98 | 0.5 | 5, 3, 3, 2, 1 | 3.3 | 2.8 |
| Austria | 6.1 | 22.3 | 43.2 | 118 | 0.4 | 2, 3, 5, 4, 1 | 3.0 | 3.0 |
| Belgium | 5.6 | 13.7 | 40.6 | 114 | 0.5 | 2, 1, 5, 4, 1 | 2.4 | 2.6 |
| Czechia | 2.6 | 15.1 | 24.6 | 92 | 2.6 | 1, 2, 3, 2, 3 | 2.0 | 2.2 |
| Poland | 6.3 | 11.5 | 6.3 | 81 | 4.3 | 2, 1, 1, 1, 5 | 1.7 | 2.0 |
| Germany, home market, not scored | 52.1 | 22.9 | 13.7 | 115 | 0.2 | - | - | - |
France has by far the largest pool, EUR 19.8 billion of household furniture spending in 2022, about twice the Netherlands. It ranks third because fewer people there buy furniture online and income per head is lower, and fourth with equal weights. The biggest market and the right first market are separate questions.
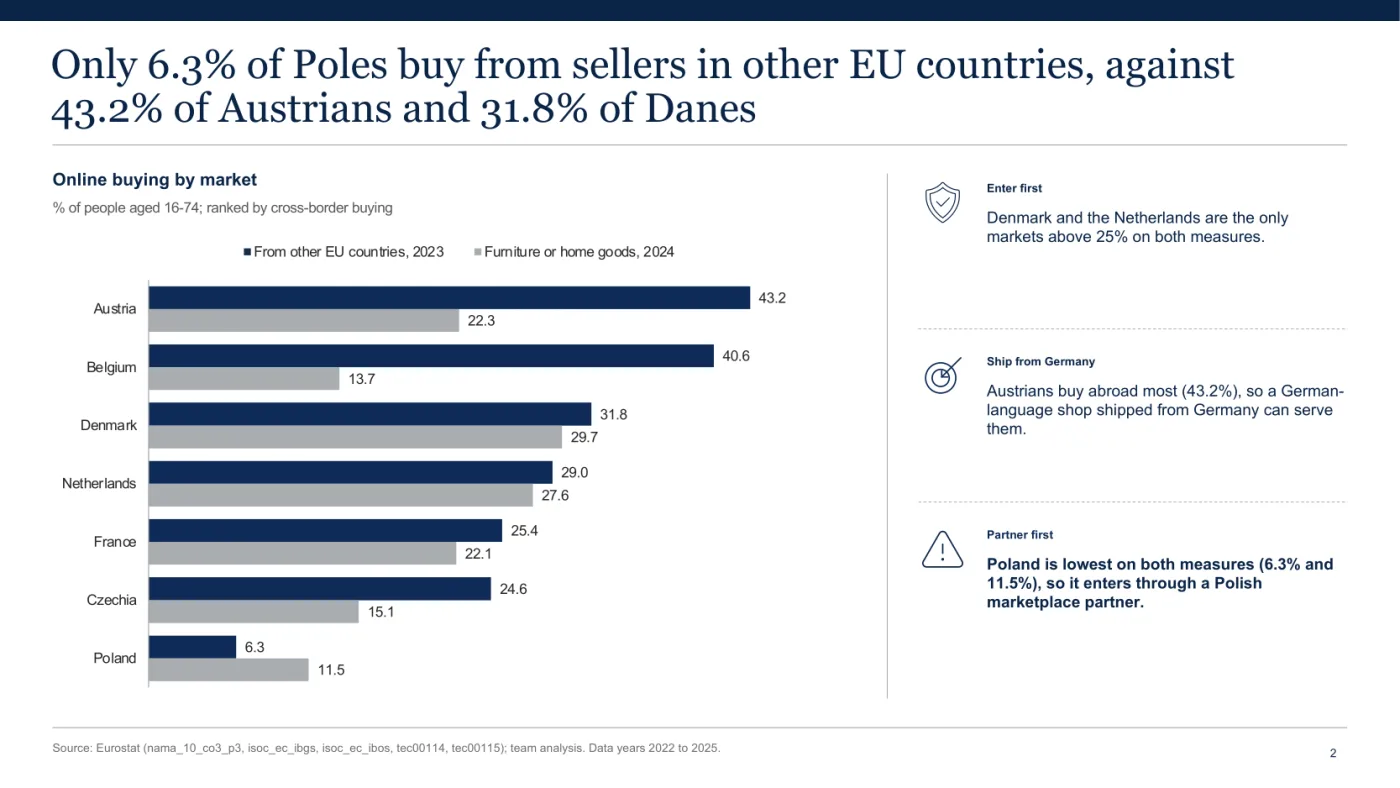
Poland is the result a quick answer would get wrong. Its GDP per head grew fastest of the seven in 2025, at 4.3%, and its households spent more on furniture in 2022 than Austria’s or Belgium’s. Yet it scores the lowest mark on online furniture buying, cross-border buying and GDP per head. Only 6.3% of Poles bought from a seller in another EU country in 2023, against 43.2% of Austrians and 13.7% of Germans (isoc_ec_ibos). For a retailer shipping from Germany, that number sets the route: in Poland the way in is a local marketplace partner, or nothing yet. Denmark and the Netherlands are the only two of the seven above 25% on both online buying measures.
The screen has a known gap. It leaves out language, which the CAGE framework counts as cultural distance. Austria shares German with the home market, so a language criterion would lift it. Put that in the slide’s note before someone in the meeting points it out.
Which entry route fits depends on how each market already buys
Order the routes by commitment, from selling through someone else’s channel to owning a local business, then pick one per market by how readily its shoppers already buy from sellers abroad. Johanson and Vahlne’s Uppsala model (1977) describes firms raising their commitment to a foreign market step by step as they learn about it, which argues for starting with routes you can reverse. Canada’s Trade Commissioner Service covers the same range for exporters: direct and indirect exporting, such as selling through distributors, online platforms or intermediaries, and, for services, a local presence through subsidiaries or partnerships.
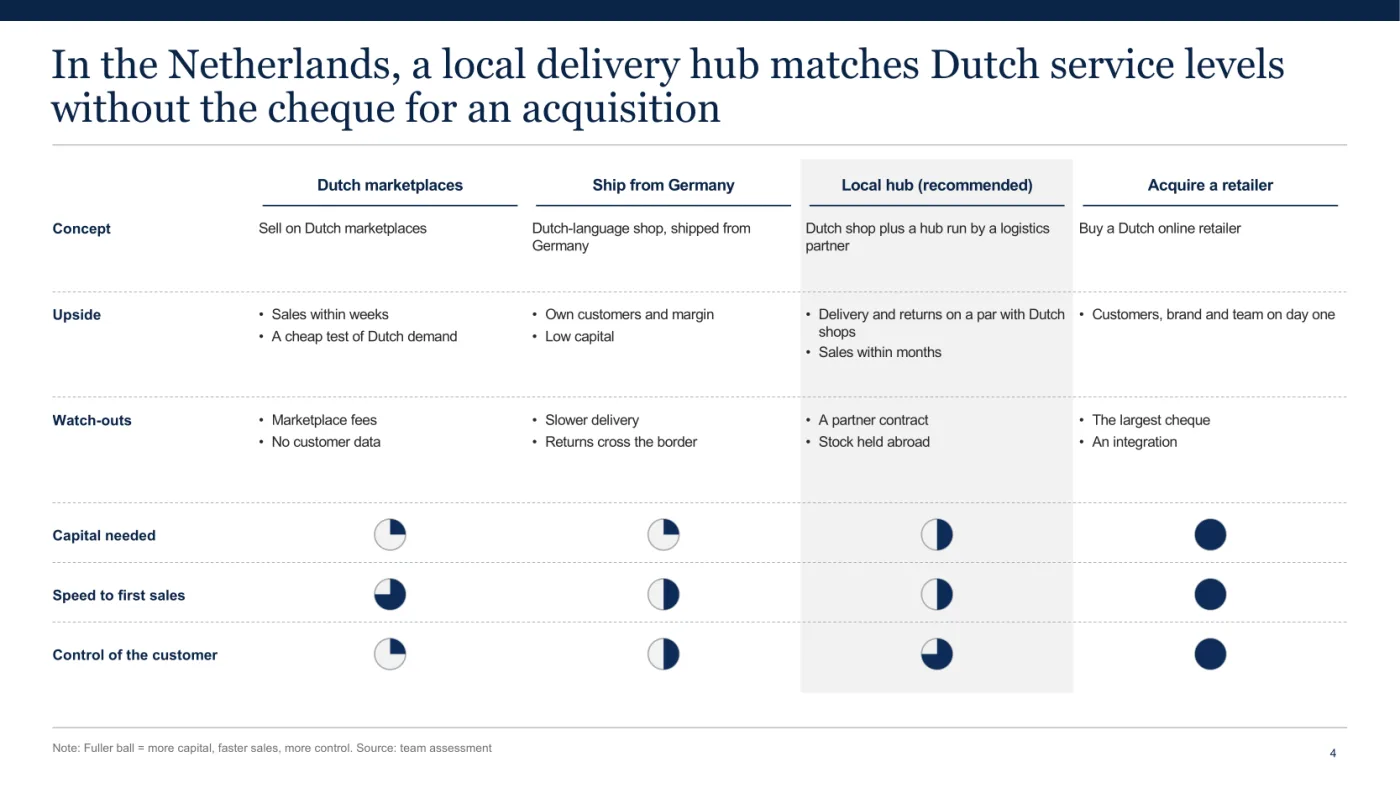
For its first market, the Netherlands, the fictional company weighs four routes, in plain terms because no cost figures exist:
| Route | Capital | First sales | What it costs | What it buys |
|---|---|---|---|---|
| Sell on Dutch marketplaces | Low | Within weeks | Marketplace fees, no customer data | A cheap test of Dutch demand |
| Ship from Germany with a Dutch-language shop | Low | Months | Slower delivery, returns cross the border | Own customers and margin |
| Dutch shop plus a local delivery and returns hub run by a logistics partner (recommended) | Medium | Months | A partner contract and stock held abroad | Delivery and returns on a par with Dutch shops |
| Acquire a Dutch online retailer | Highest | Day one | The largest cheque and an integration | Customers, brand and team at once |
In the other six markets the cross-border share does most of the choosing. Austrians (43.2%) and Danes (31.8%) already buy readily from sellers in other EU countries, so a local-language shop shipped from Germany is enough there. Only 6.3% of Poles do, so Poland goes through a Polish marketplace partner. France, the largest pool, gets a local logistics partner, and Belgium is served from the Dutch hub. The choices are the fictional company’s. The logic carries over: where shoppers rarely buy across a border, a local channel has to carry the trust.
The slide also rates the four Dutch routes with quarter-filled balls, in the table’s order, and the ratings are that company’s judgement: capital needed a quarter, a quarter, a half and full; speed to first sales three quarters, a half, a half and full; control of the customer a quarter, a half, three quarters and full.
A roadmap should name the condition that releases each wave
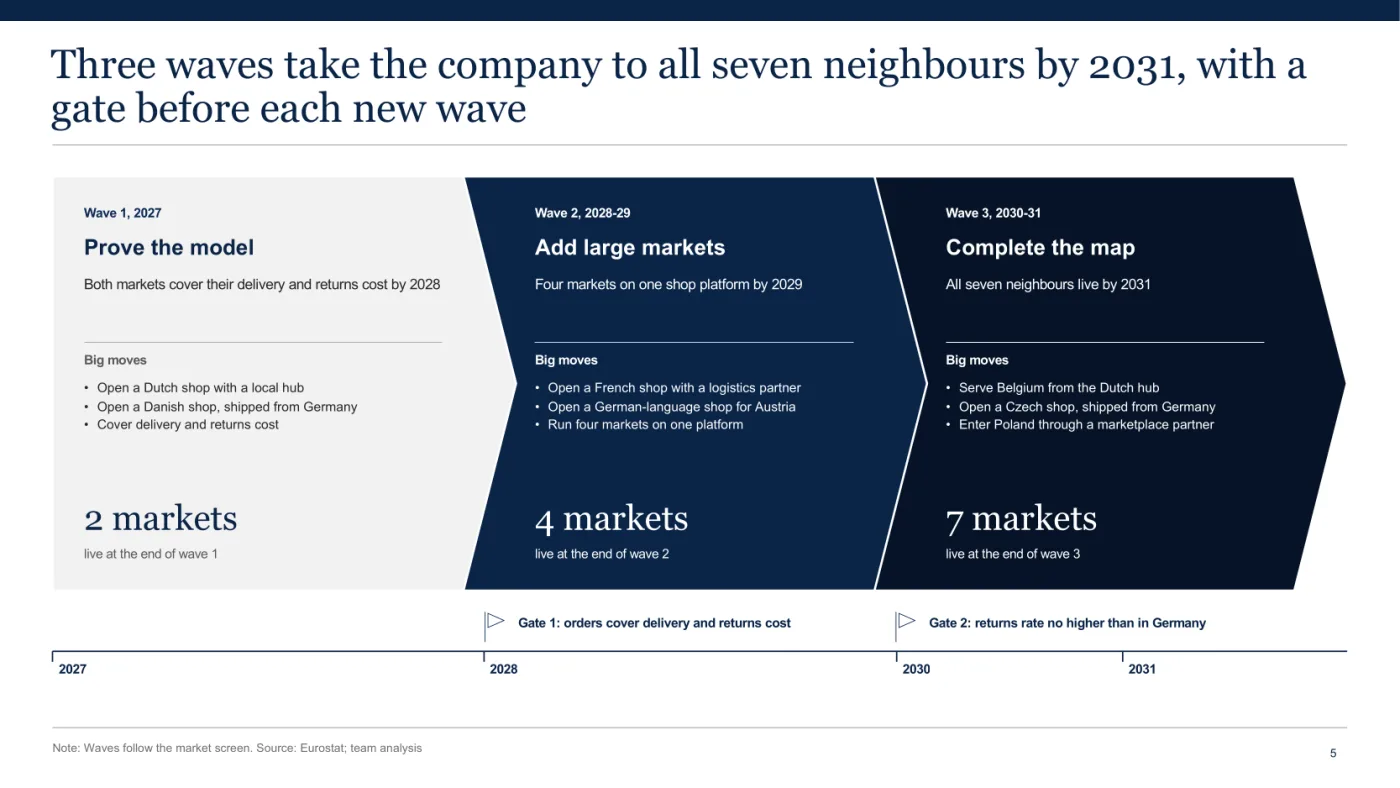
Sequence the markets in waves and put a gate between them: a measurable condition the earlier wave must meet before money goes into the next. A list of dates commits the committee to every market at once, while a gate lets it approve wave 1 and keep the decision on the rest.
The worked example uses three waves and two gates, with the waves following the scores, and goes from two live markets to four to seven:
- Wave 1, 2027: the Netherlands (Dutch shop and local delivery hub) and Denmark (Danish shop, shipped from Germany). Target: both cover their delivery and returns cost by 2028.
- Gate 1: wave 1 orders cover their own delivery and returns cost.
- Wave 2, 2028-29: France (French shop with a local logistics partner) and Austria (German-language shop, shipped from Germany). Target: four markets on one shop platform by 2029.
- Gate 2: the returns rate abroad is no higher than in Germany.
- Wave 3, 2030-31: Belgium (served from the Dutch hub), Czechia (Czech shop, shipped from Germany) and Poland (through a Polish marketplace partner). Target: all seven neighbours live by 2031.
Both gates are numbers the finance team can read off a monthly report. A gate that says “wave 1 is going well” is a date with extra steps.
How to brief Decky AI for a market entry deck: one block per slide
Name each template in the prompt and give each slide its own block in the context, with its title, its figures and its wording. Each template then gets the material meant for it, and the chart gets the series you intended.
These slides were built with Decky’s MCP connector from an AI assistant: fill_templates with
five library templates, in this order “Recommendation summary”, “Competitive positioning”, “Country
scorecard”, “Options comparison” and “Transformation roadmap”, on Decky’s built-in Professional
Blue master. Through the connector Decky receives the figures as text and never sees the files
behind them; Introducing Decky MCP explains the setup. The prompt,
exactly as sent:
Five slides for the executive committee of a fictional German online retailer of furniture and home accessories that is choosing its first EU neighbour to enter. Fill each template in this order with the block of the same number in the context, and use each block's title word for word. Slide 1 (Recommendation summary): block 1. Slide 2 (Competitive positioning): block 2; its chart compares the seven markets, not criteria, so the categories are the seven markets and the two series are the two buying measures. Slide 3 (Country scorecard): block 3. Slide 4 (Options comparison): block 4. Slide 5 (Transformation roadmap): block 5. Use only the figures in the context and quote them exactly. Every slide carries the source line from the context. The company and its plan are fictional: add nothing that is not in the context.
The context gave each slide its own block. It is shortened here: the bracketed lines held the rows of the tables above and each slide’s wording, for 6,741 characters in all. Block 2 is printed whole, as the pattern for the others.
Company (fictional): a German online retailer of furniture and home accessories, home market Germany. Question for its executive committee: which EU neighbour to enter first, how, and in what order. The company, its routes and its plan are fictional. All market figures are real Eurostat data.

Scope: Germany's EU neighbours with more than 5 million people: Austria, Belgium, Czechia, Denmark, France, Netherlands, Poland.

Market data (Eurostat):
[criteria A to E with their dataset codes and years, as listed above]
Market: A / B / C / D / E
Netherlands: 10.0 / 27.6 / 29.0 / 133 / 1.0
[one line like this per market, then Germany for reference]

Source line for every slide: Source: Eurostat (nama_10_co3_p3, isoc_ec_ibgs, isoc_ec_ibos, tec00114, tec00115); team analysis. Data years 2022 to 2025.

BLOCK 1, recommendation.
Title: Enter the Netherlands and Denmark first in 2027: they lead the screen and their shoppers already buy online
[the recommendation, three reasons with proof number, label and evidence, the ask, who decides]

BLOCK 2, cross-border chart.
Title: Only 6.3% of Poles buy from sellers in other EU countries, against 43.2% of Austrians and 31.8% of Danes
Chart heading: Online buying by market
Chart unit: % of people aged 16-74; ranked by cross-border buying
Chart categories, top to bottom: Austria, Belgium, Denmark, Netherlands, France, Czechia, Poland
Series 1, From other EU countries, 2023: 43.2, 40.6, 31.8, 29.0, 25.4, 24.6, 6.3
Series 2, Furniture or home goods, 2024: 22.3, 13.7, 29.7, 27.6, 22.1, 15.1, 11.5
First readout: Denmark and the Netherlands are the only markets above 25% on both measures.
Second readout: Austrians buy abroad most (43.2%), so a German-language shop shipped from Germany can serve them.
Third readout: Poland is lowest on both measures (6.3% and 11.5%), so it enters through a Polish marketplace partner.

BLOCK 3, scorecard.
Title: The Netherlands and Denmark lead the seven-market screen; Poland ranks last under either weighting
[criteria and weights, then per market a descriptor, five scores, the total and the wave]

BLOCK 4, entry routes for the Netherlands (fictional company's assessment, no cost figures exist).
Title: In the Netherlands, a local delivery hub matches Dutch service levels without the cheque for an acquisition
[four options with concept, upside and watch-outs, three rating rows, the note line]

BLOCK 5, roadmap (fictional plan; waves follow the scores).
Title: Three waves take the company to all seven neighbours by 2031, with a gate before each new wave
[three waves with timing, name, goal, three moves and markets live, two gates, year labels]
The judgement stays with you. The markets, criteria, weights, scores, waves, routes and titles in this example are mine, from the Eurostat data, and they went in through the brief. Decky turned them into slides: it placed the text in each slot, drew the dot ratings from the scores and built the chart as a native PowerPoint chart from the two series.
Why build your market entry deck with Decky AI
Decky AI works inside PowerPoint, so a market entry deck stays a normal presentation: real text, native charts you can open and edit, and your own master or one of Decky’s built-in ones. You bring the analysis, and Decky does the slow part, which is getting it onto consulting-format slides.
You also skip the blank page. Decky’s library holds a complete Market entry study deck of 18 slides in three sections (which market, how we enter, capital and payback), in nearly the order this guide recommends, plus single templates for a market attractiveness map, a country scorecard, entry routes and a roadmap with gates. In the add-in, attach the deck to a chat message next to your documents: Decky drafts one storyline across its slides on an outline card you can edit, and fills the slides once you approve.
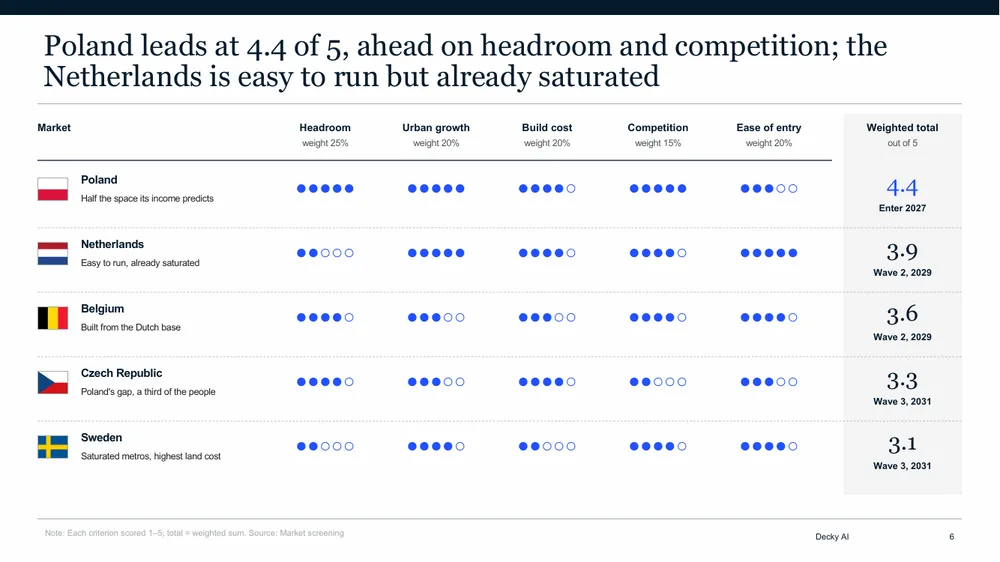
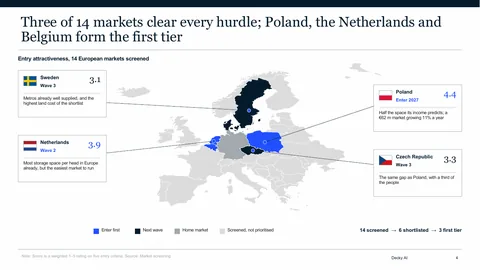
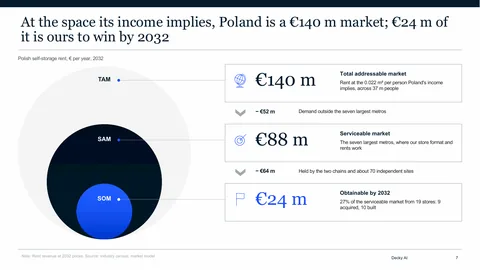
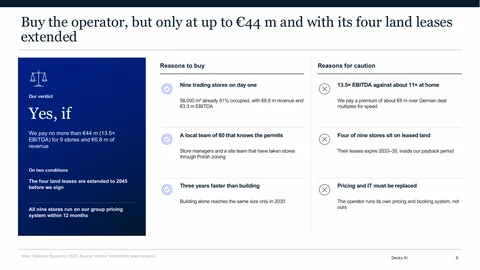
Your figures go in as you wrote them, and charts are built from your data. A fact your material lacks comes back as a visible “to confirm” placeholder, listed at the end, so you see the gap before the committee does. The answer follows your numbers as well: that library deck’s sample company is a fictional German self-storage operator, and there Poland comes first, while for the furniture retailer here it comes last.
If you have a screen of your own, run the same brief against your own template.

Maximilian Nitsche · Founder, Decky AI
I built Decky AI so anyone can put an MBB-level slide together and still be done before 8pm. I write here about the craft of consulting decks, and about what we ship.